USD/CAD Price Analysis: Move beyond 100- SMA on H4 to pave the way for further intraday gains
- USD/CAD edges higher for the second straight day, albeit lacks any follow-through buying.
- Sliding Crude Oil prices undermines the Loonie and is seen lending some support to the pair.
- Subdued USD demand caps the upside amid mixed technical setup on hourly and daily charts.
The USD/CAD pair attracts some buying for the second straight day on Monday and trades near the top end of its daily range, around the 1.3220-1.3225 region during the early European session.
China's second-quarter GDP print falls short of market expectations and raises concerns concern about the fuel demand in the world's top crude importer. This, along with the resumption of production in Libya, drags Crude Oil prices away from the highest level since April, which, undermines the commodity-linked Loonie and acts as a tailwind for the USD/CAD pair. The upside, however, remains capped in the wake of subdued US Dollar (USD) price action.
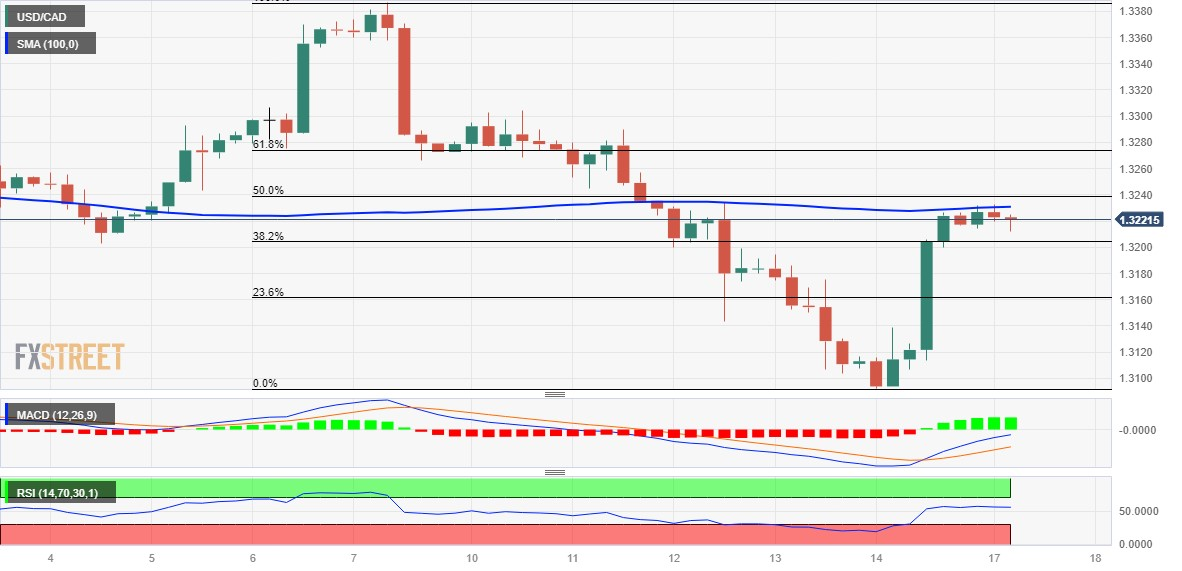
From a technical perspective, the USD/CAD pair's strong recovery from sub-1.3100 levels, or its lowest level since September 2022 stalls near 100-period Simple Moving Average on the 4-hour chart. This is closely followed by the 50% Fibonacci retracement level of the recent downfall witnessed over the past week or so, which if cleared decisively might be seen as a fresh trigger for bullish traders and pave the way for some meaningful intraday appreciating move.
The USD/CAD pair might then climb to test the 61.8% Fibo. level, around the 1.3270 region, before aiming to reclaim the 1.3300 round-figure mark. Some follow-through buying will suggest that spot prices have formed a near-term bottom and set the stage for a move back towards challenging the monthly swing high, around the 1.3385 zone. That said, technical indicators on the daily chart are still holding in the negative territory and warrant caution for bullish traders.
On the flip side, the 1.3200 mark, or the 38.2% Fibo. level now seems to protect the immediate downside, which if broken might expose the 23.6% Fibo., around the 1.3150 area. Some follow-through selling will suggest that the corrective rebound has run its course and make the USD/CAD pair vulnerable to challenge the YTD low, around the 1.3095-1.3090 region.
USD/CAD 4-hour chart
Key levels to watch