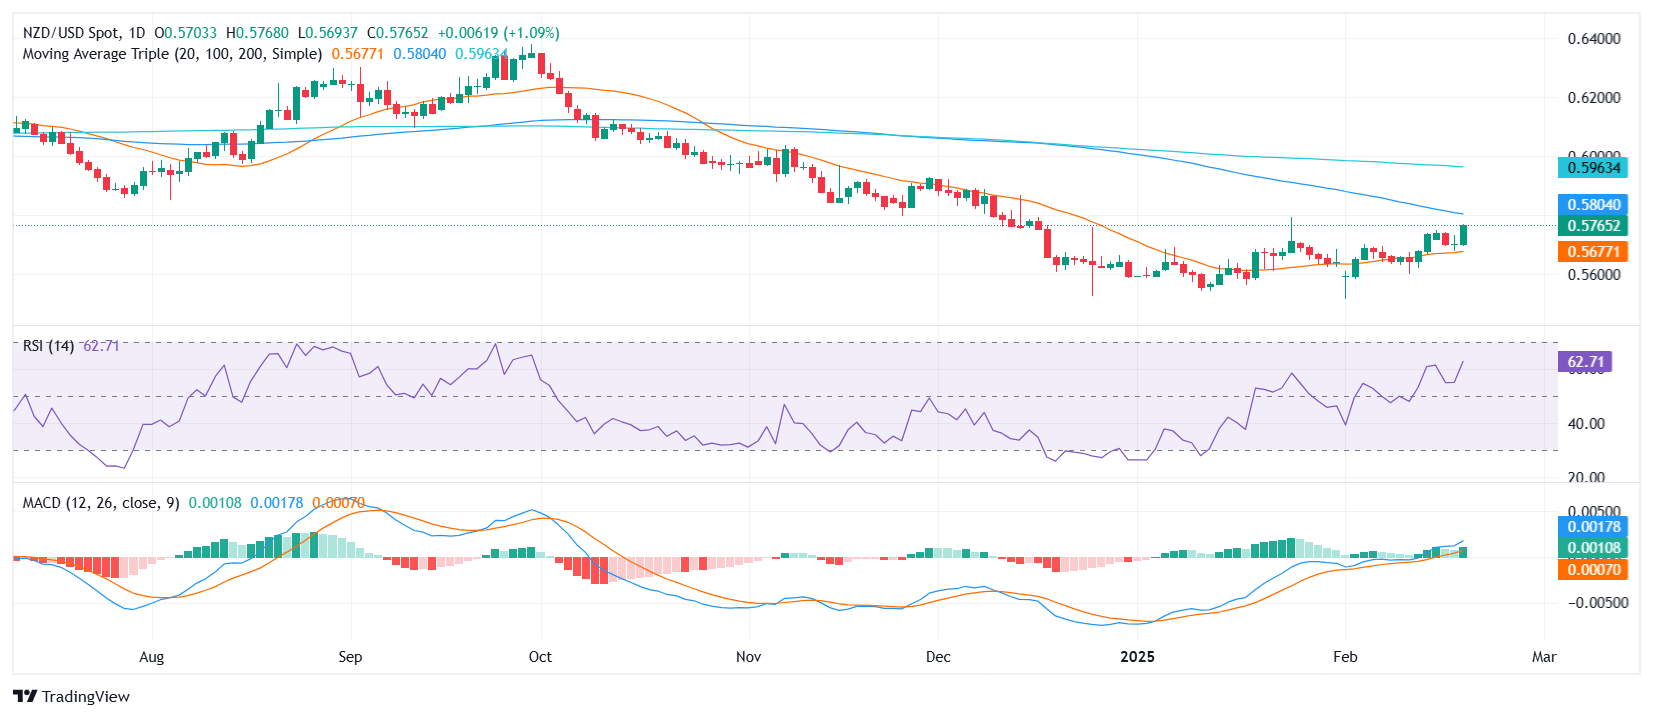
NZD/USD Price Analysis: Bulls surge to back to highs since January, eyeing 100-day SMA retest
- NZD/USD jumps to 0.5765 on Thursday, reaching its highest level since January.
- The RSI climbs to 62, nearing overbought territory but still signaling room for further gains.
- MACD histogram shows rising green bars, indicating sustained bullish momentum and potential for continued upside.
The NZD/USD pair staged an impressive rally on Thursday, climbing 1.03% to close at 0.5765, marking its highest point since January. Buyers regained control, building on recent momentum as the pair looks poised to retest the 100-day Simple Moving Average (SMA), which stands as the next major resistance level.
Technical indicators support the bullish outlook. The Relative Strength Index (RSI) surged to 65, edging closer to overbought territory but still offering room for additional upside before triggering exhaustion signals. Meanwhile, the Moving Average Convergence Divergence (MACD) histogram continues to print rising green bars, highlighting sustained buying pressure and strengthening momentum.
Looking forward, a successful break above the 100-day SMA, currently around 0.5805, could open the door for further gains, potentially extending the bullish trend. On the downside, immediate support is seen near 0.5700, with a drop below this level potentially triggering a deeper correction. However, with indicators still favoring buyers, the near-term bias remains tilted to the upside.

