Back
16 Jul 2018
EUR/USD Technical Analysis: Slow and steady grind keeps EUR/USD above 1.1700 mark
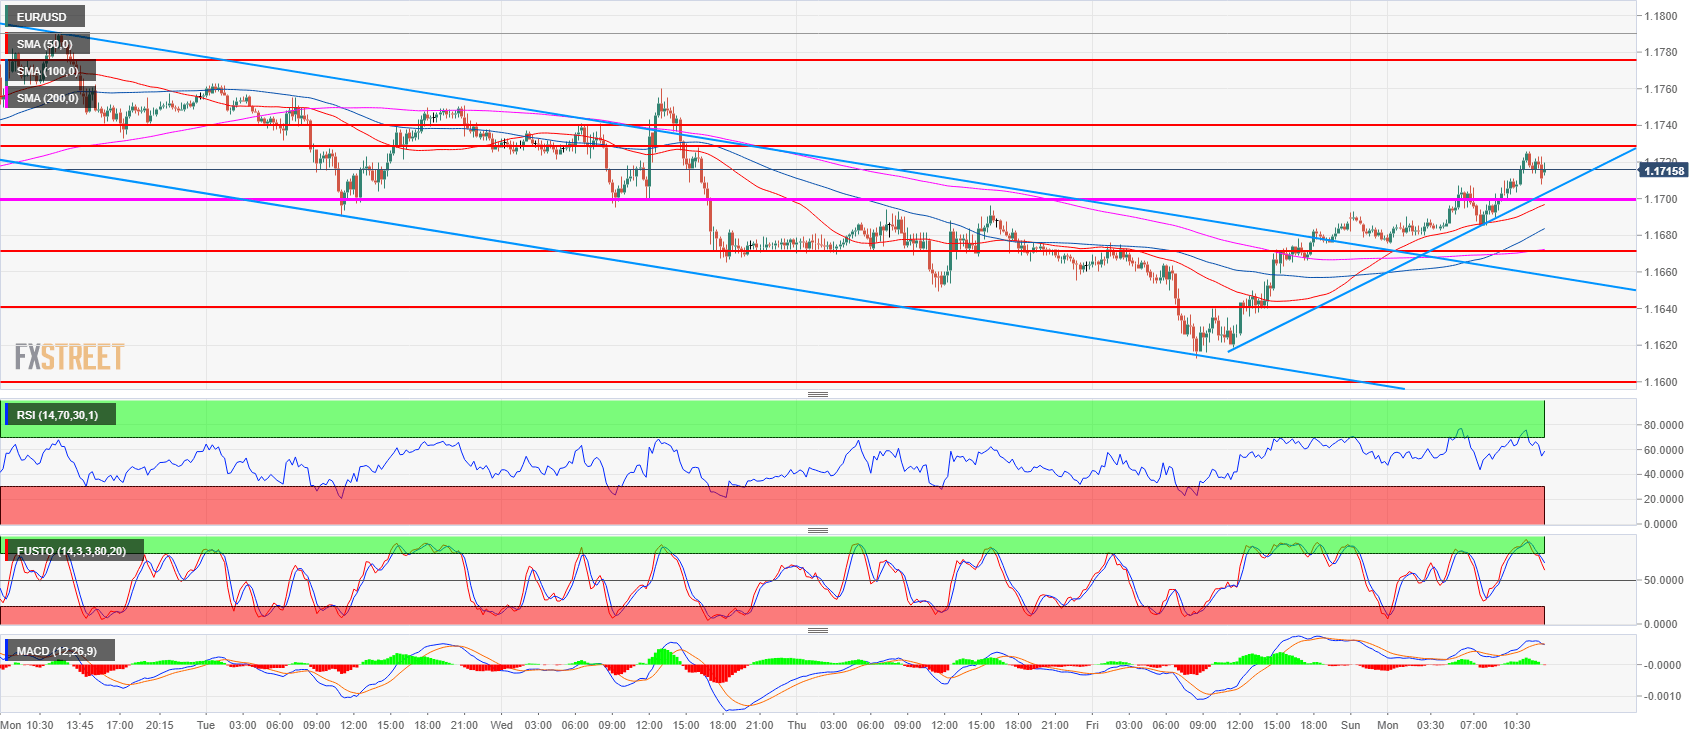
- EUR/USD is starting the week on the front foot as EUR/USD printed a fairly strong bull reversal last Friday. EUR/USD is currently having a decent bullish momentum as it is trying to breakout above the 1.1730-1.1740 area.
- If buyers manage to push beyond 1.1730-1.1740 area, the next scaling point to the upside might be located near 1.1790 last week’s high.
- On the flip side, if bulls fail to breakout above 1.1730-1.1740, the market might drift back to test the 1.1700 support.
EUR/USD 15-minute chart

Spot rate: 1.1716
Relative change: 0.26%
High: 1.1726
Low: 1.1675
Trend: Neutral to bullish
Resistance 1: 1.1730-1.1740 area, 23.6% Fibonacci retracement from mid-April-May bear move and last week’s open.
Resistance 2: 1.1790 last week’s high
Resistance 3: 1.1851-1.1854 area, June high and 38.2% Fibonacci retracement from mid-April-May bear move
Support 1: 1.1700 figure
Support 2: 1.1672 June 27 high
Support 3: 1.1640-1.1649 area, key level and July 12 low
Support 4: 1.1613 current weekly low
Support 5: 1.1600 figure
Support 6: 1.1560 June 14 low
Support 7: 1.1508 current 2018 low
