Back
6 Jun 2019
USD/JPY technical analysis: Down 0.20%, but bearish momentum is losing steam
- The daily chart shows a bullish divergence of the RSI.
- The pair created a bullish engulfing candle on Wednesday.
USD/JPY is currently trading at 108.22 – down 0.20% on the day.
However, with the 14-day relative strength index (RSI) diverging in favor of the bulls with higher lows, the probability of the pair suffering a deeper drop below Wednesday’s low of 107.82 appears quite low.
Further, the bullish engulfing candle created on Wednesday would gain credence if the spot closes today above 108.49. That would also validate the bullish divergence of the RSI and open the doors for a move above 109.00.
Both bullish divergence of the RSI and Wednesday’s bullish engulfing candle would be invalidated if the spot closes today below 107.82.
Daily chart
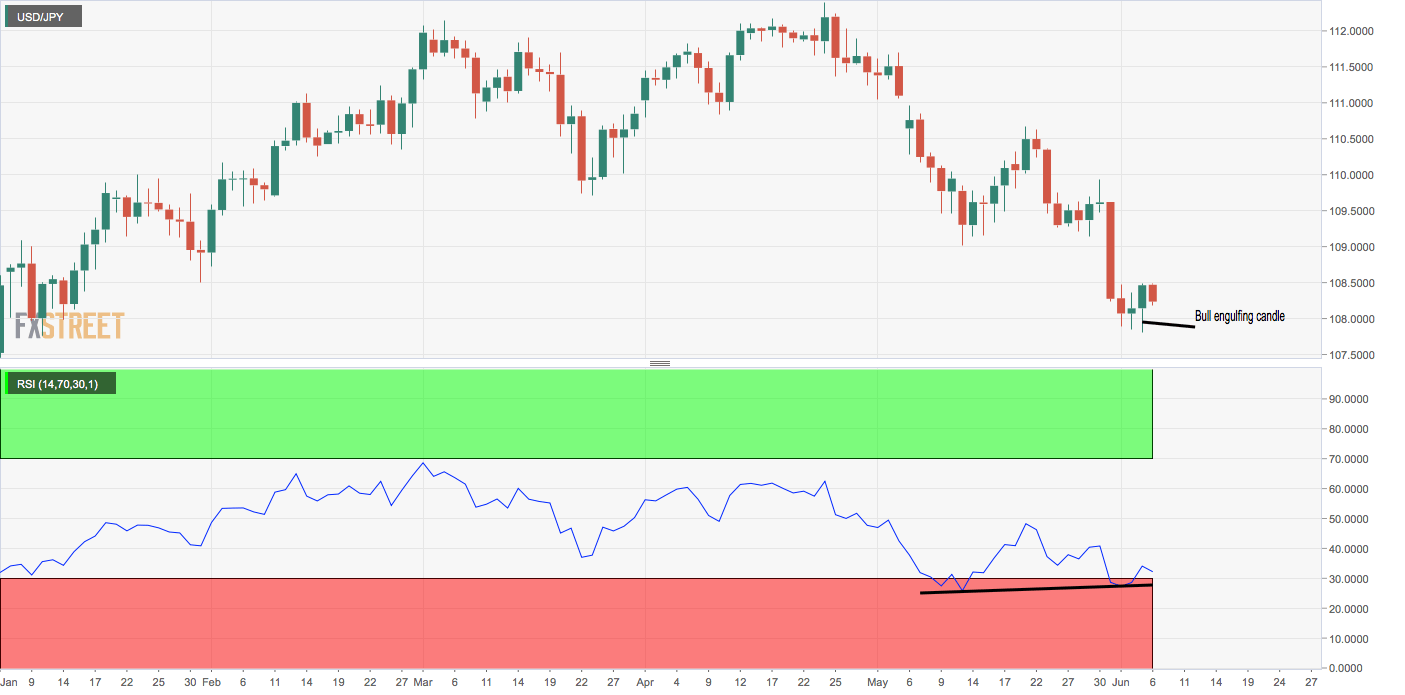
Trend: Bear exhaustion
Technical levels