USD/CNH Price Analysis: Prints falling wedge on 4H below 6.9100
- USD/CNH bounces off intraday low of 6.9005, marks a two-day losing streak.
- Sluggish momentum indicators challenge bullish chart formation.
- 200-bar SMA adds to the upside barriers, the yearly bottom gains the bears’ attention.
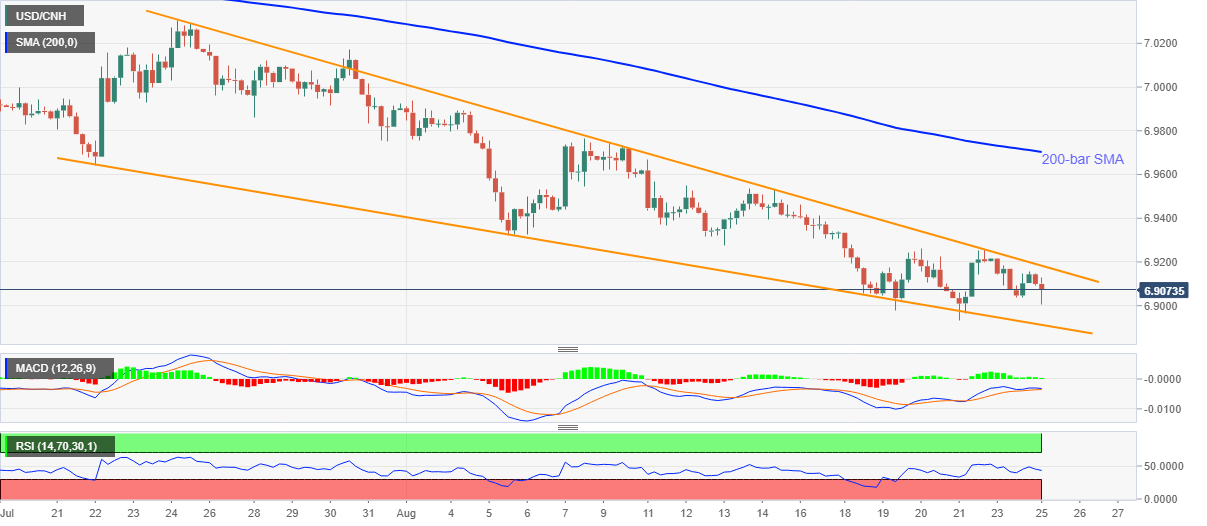
USD/CNH picks up bids near 6.9080 amid the initial trading session on Tuesday. Even if the cross drops for the second day, a falling wedge formation on the four-hour chart (4H) keeps the bulls hopeful.
Other than the pair’s latest weakness, downbeat conditions of RSI and MACD also challenges the buyers.
Even so, a sustained break of 6.9180 resistance will theoretically confirm the quote’s run-up towards breaking the monthly top surrounding 7.000 round figures.
During a north-run, the 200-bar SMA level near 6.9700 will act as an intermediate halt whereas the late-July top surrounding 7.0300 could the optimists afterward.
Meanwhile, the seven-month low flashed, on Friday, around 6.8930 and the support line of the said bullish formation near 6.8910 challenges the sellers targeting the yearly bottom near 6.8455.
USD/CNH four-hour chart
Trend: Pullback expected