USD/INR Price News: Indian rupee eases below 74.00 inside short-term triangle
- USD/INR picks up bids while extending bounce off 73.47.
- Bearish MACD suggests further downside towards the monthly low.
- Upside break of triangle needs validation from month’s top.
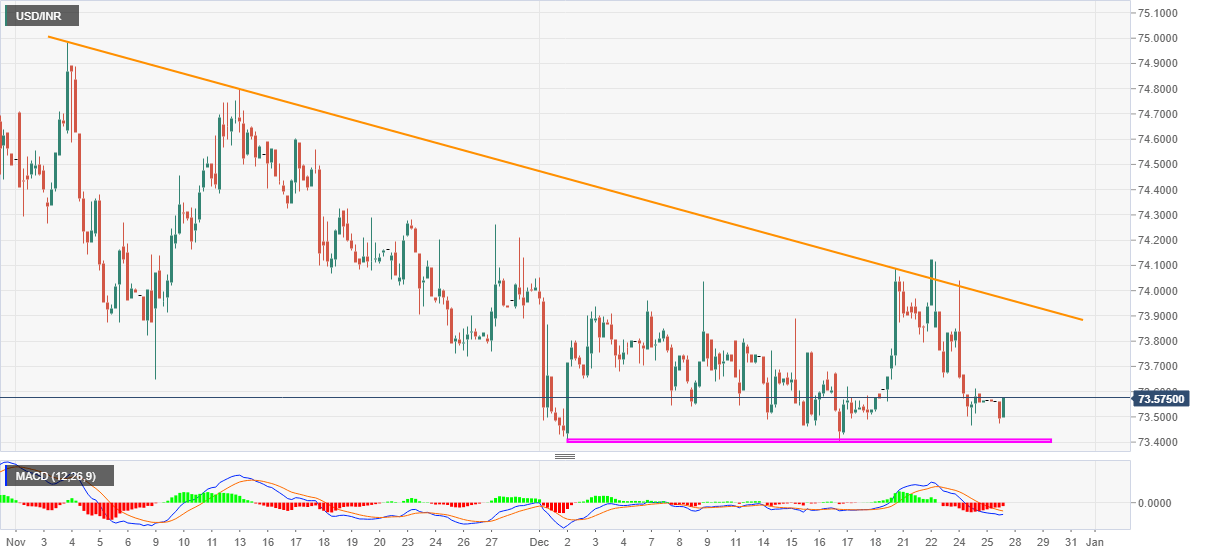
USD/INR rises to 73.57 while reversing the early-Asian losses during the initial hour of Indian trading. In doing so, the Indian rupee pair wavers near the monthly low.
If looking at the lower high formation since November 04, the quote seems to portray a descending triangle, bullish chart pattern on the four-hour (4H) play.
However, bearish MACD, coupled with multiple failures to stay positive beyond the 74.00 threshold keeps USD/INR sellers hopeful unless the quote remains below the triangle’s resistance line, at 73.97 now.
Also acting as the upside barrier is the monthly peak surrounding 74.12, a break of which will propel the quote towards the early-November tops near 74.80 before highlighting the 75.00 theshold for the USD/INR bulls.
On the downside, the monthly low near 73.40, followed by October’s low near 72.96, entertain USD/INR bears during the pullback moves.
USD/INR four-hour chart

Trend: Pullback expected
