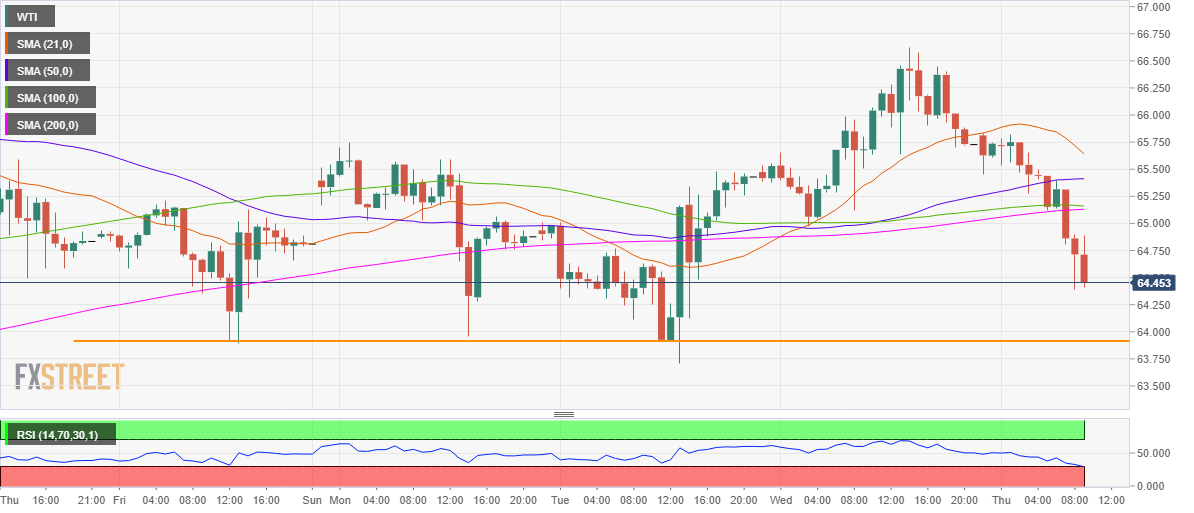
WTI Price Analysis: On its way to test key $64 support area
- WTI sellers remain alive and kicking as inflation fears roil markets.
- The US oil pressured by Colonial Pipeline restart news, ignores EIA data.
- Hourly chart shows a test of the key support near $64 appears inevitable.
WTI (futures on NYMEX) is extending its correction from weekly highs of $66.62, down nearly 2.5% on the day, as the $64 mark remains at risk.
At the time of writing, WTI is testing lows around $64.40, weighed down by the news that the Colonial pipeline is likely to restart its operations. Meanwhile, the turmoil in the global equities, courtesy of mounting inflation concerns, exerts additional pressure on the higher-yielding oil.
Meanwhile, markets shrug off a drawdown in the Energy Information Administration’s (EIA) weekly US crude stockpiles and a sharp drop in the exports.
From a near-term technical perspective, the risks remain tilted to the downside after the price pieced through the critical 100 and 200-simple moving average (SMA) on hourly sticks.
The sell-off intensified on a break below the aforesaid support levels, which coincide at $65.15, opening floors for a test of static support at $63.90.
WTI one-hour chart

The bulls, however, could manage to defend that downside cap, as the Relative Strength Index (RSI) has entered into the oversold territory.
Any pullbacks could test the $65.15 support now resistance, above which the 50-SMA at $65.42 could be put to test.
Further up, the bearish 21-SMA at $65.64 could threaten the recovery.
WTI additional levels
