GBP/USD Price Analysis: Sellers need validation from 100-DMA
- GBP/USD remains pressured towards the key moving average, keeping Friday’s pullback.
- Steady RSI, failures to cross 21-DMA, 61.8% Fibonacci retracement favor sellers.
- Bulls remain worried until witnessing upside break of 1.3630.
GBP/USD stays depressed around 1.3530, keeping the previous day’s pullback moves during Monday’s Asian session.
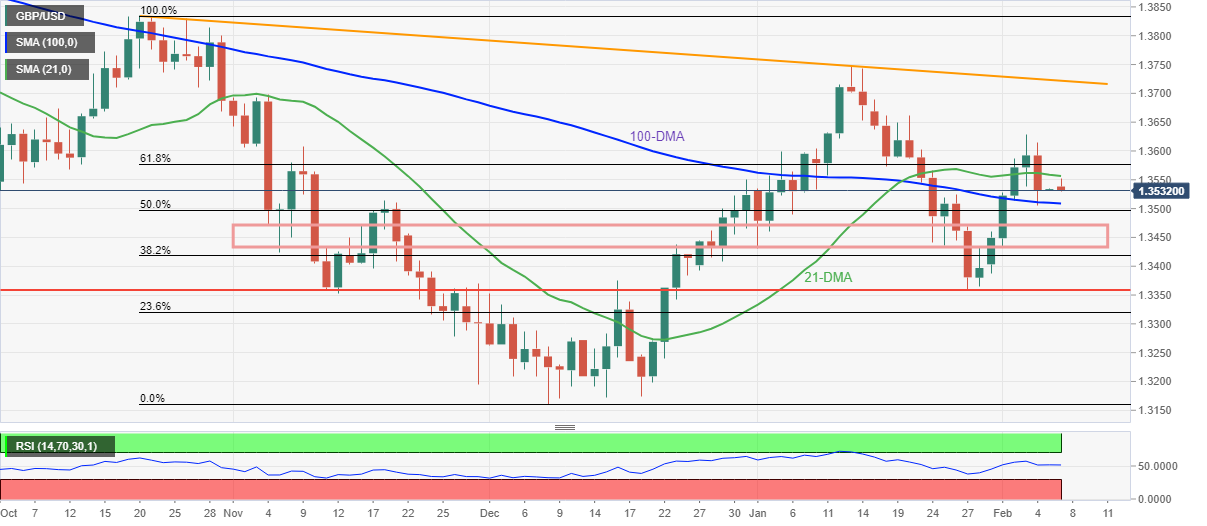
In doing so, the cable pair remains below 21-DMA and the 61.8% Fibonacci retracement (Fibo.) level of October-December 2021 downside.
Given the steady RSI and the pair’s inability to stay beyond the key resistances, the latest declines are likely to extend towards the nearby support, namely the 100-DMA level surrounding 1.3510 and the 1.3500 threshold.
It’s worth noting that a broad support area between 1.3470 and 1.3430, comprising multiple levels marked since early November 2021, will challenge the GBP/USD to bear past 1.3500.
Should the quote drop below 1.3500, a three-month-old horizontal line near 1.3360-55 may lure the pair sellers.
Alternatively, the 21-DMA and 61.8% Fibo. level guard short-term recovery of the GBP/USD pair around 1.3555 and 1.3580.
Following that, February’s top around 1.3630 will act as a last defense for the bears before directing the quote to a downward sloping trend line from October 2021, around 1.3720.
GBP/USD: Daily chart
Trend: Further weakness expected